Insight-driven data analytics for a new era of data protection
As IT infrastructures become more complex and demands for performance rise, companies require visibility and control over protected IT environments. Visibility of your entire IT infrastructure (both on-premises or cloud) is imperative to monitor, analyze and plan your environment and resource requirements to ensure zero interruptions. To have confidence that business Service level Agreements (SLAs) are met, you need not only visibility and insights to address existing issues, but also to be able to plan for your future data protection needs.
Zerto Analytics delivers these capabilities through a single interface and one user experience for a comprehensive overview of your entire multi-site, multi-cloud environment. Utilizing metrics such as average recovery point objective (RPO), network performance, and storage consumption, Zerto Analytics delivers real-time and historical insights on the health and protection status of your applications and data. Through Intelligent dashboards you can spot trends, identify anomalies, and troubleshoot issues in network, RPO, and other business SLAs. With these insights, you can eliminate inefficiencies and allocate resources effectively to mitigate data loss, reduce downtime and take control of your data.
New Resource Planner
With Resource Planner, you can ensure your data protection needs are met as your IT environment grows and diversifies. Use the Resource Planner to monitor and perform analysis of your protected environment to determine the required compute, storage and networking resources for any or all virtual machines (VMs) within your environment, both on-premises or in the cloud. Build out your data protection strategy with 'what-if' scenario modeling to plan for VM protection across clouds or on-premises, or to transition from on premises to cloud, or to protect additional VMs within your environment.
Zerto Analytics is developed with an API first approach, therefore, everything that is presented in the GUI, is also available with APIs. The APIs are delivered with Swagger open source that help you develop and test REST integration using standardized examples. This allows to easily populate custom portals with Zerto Analytic content.
■ From the ZVM Application Menu tab: Click to open Zerto Analytics in a new browser tab.
Accessing Zerto Mobile
The Zerto Mobile app is available for both iOS or Android operating systems.
Sign in using your myZerto credentials.
Zerto Analytics APIs
Zerto Analytics is developed with an API first approach, therefore, everything that is presented in the GUI, is also available with APIs. APIs are available the same version as their GUI counterparts.
After accessing Zerto Analytics, the Dashboard opens by default. This view displays a summary of the entire protected environment, including the average RPO and VPG health, site details and topology, active alerts, running tasks and events.
Use the What’s New and Help widgets in Zerto Analytics to learn more about each of the features available in Zerto Analytics.
In addition to the Dashboard, there are additional views that provide details on the overall health of your environment.
■ Use the sites topology to identify sites without remote protection, to identify network issues and to identify cloud issues.
■ To handle any issues in the ZVM site, in the Dashboard tab > SITES area, click the icon Open ZVM in new tab. This routes you to the specific ZVM site.
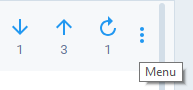
■ In the same Sites area, click the Menu button to navigate to the VPGs, Alerts or Tasks for the specified site.
From the Monitoring tab review the active alerts, alerts history, running events and tasks.
To see active alerts, events or tasks from a specific ZVM, use the filter in the top left of the screen .
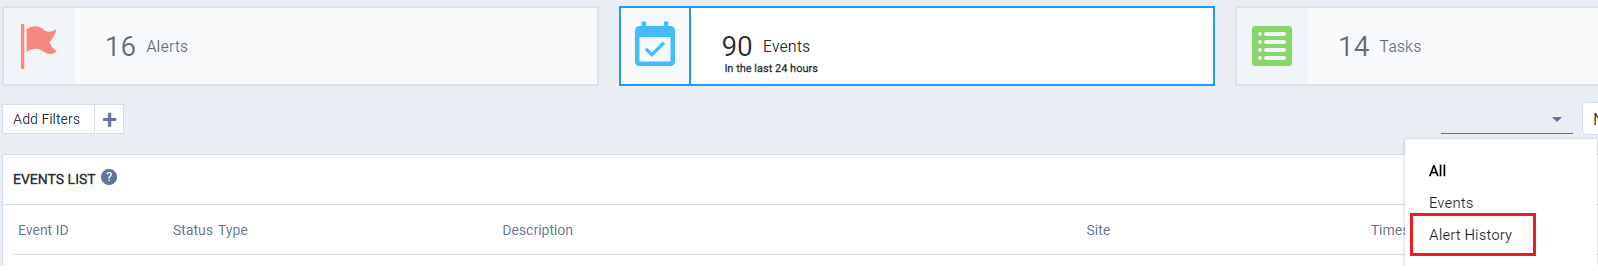
Events are displayed for the last 24 hours by default. Use the date selector to filter the Events List by date.
To view a history of alerts, select the Events tab and Alert History in the sub menu. Inactive alerts are displayed for the selected time range.
TIP:
Click the Alert ID and Event ID to open the help and view the full details for that specific alert or event.
Troubleshooting VPGs
From the VPGs tab, review the list of VPGs with Errors and Warnings. In the VPGs status area, click either VPGs with Warnings or VPGs with Errors to filter the VPGs list.
To review the status of a VPG, click in the column of the VPG you want to review to open the VPG Details page. From here you can view the details of the virtual machines associated with the VPG as well.
If you want to view the details of another VPG, select the VPG from the VPGs drop-down list.
TIP:
To further investigate about a selected VPG, click the VPG History button, and select to view either the RPO, Journal or Network Reports page. (See Reviewing Reports for more details about Reports).
Reviewing Reports
The SaaS Analytics reports provide real-time and historical data analysis. ECE and CSP licenses can view up to 90 days of report history. Use the date controller to filter your reports. Statistics are displayed according to the selected time frame.
TIP:
Zoom in to view more granular data by selecting and dragging your mouse over the selected time frame.
From the Reports tab, review the RPO, Journal and Network performance history on the VPGs.
Use the Network reports for reviewing the network history for any VPG or Site. You can also view the network summary for a selected time frame, the network performance history and IOPs history.
Use the RPO reports for viewing a summary to see if RPO SLAs are being met, the RPO history and the RPO breach table for viewing when the specific time breach occurred and the duration of the SLA breach.
Use the Journal reports for understanding if resilience is at risk due to journal storage capacity and plan for storage growth.
End-User Analytics for Service Providers
Service providers can filter their customers in Zerto Analytics using the ZORG filter located at the top of the screen.
Using the ZORG filter, CSPs can see historical data and status for any individual customer.
Additionally, using the Zerto Analytics APIs, CSPs can create custom reports and automate reporting delivery of real-time content to their customers. The APIs can also be used to provide content for customer portals.
Planning your Data Protection Strategy
Zerto Analytics includes the Planning tab; a resource planning capability that performs continuous monitoring and analysis to determine the required storage and networking resources for your data protection strategy. In addition, it provides recommendation for the required number of ZCAs when replicating to Azure. Analysis can be performed for any or all VMs within your VMware environment. This capability uses data collected from VMware sites and does not require any new installation or license.
The planning capability delivers visibility and forecasting into:
■ Zerto protected VMs from vSphere to a public cloud.
■ Zerto protected VMs from vSphere to an on-premise site.
■ The cost benefit analysis between deciding whether to protect VMs on-premises or in public cloud.
The resource Planning capability provides overall sizing recommendations, including number of ZCAs, WAN, Total Journal Size and Total Recovery Disk Size.
It also includes VM configuration details (CPU, RAM and Total Size) collected from vCenter, per VM calculated performance counters (Avg. Throughput, Avg. IOPS) and the Required Journal Size estimation per VM.
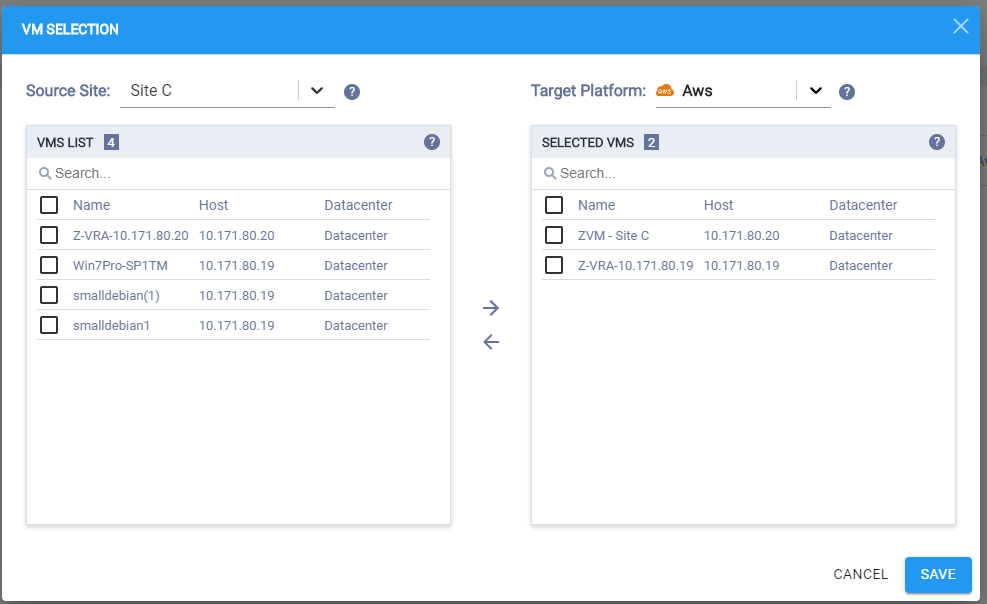
To begin planning your data strategy:
1. Click on the Planning tab; the VM Selection window opens.
2. From the VM Selection window, select your Source Site VMs and Target Platform for replication.
3. Click Save; The Planning view is displayed.
Use the Help widgets to learn more about each of the features available in Planning.
Zerto Analytics Product Feature Matrix
The following table lists the available features and from which ZVM version it’s supported:
KEY
Yes - Supported
No - Not Supported
Yes* - Supported partially See comments for further details.
Feature
ZVM v5.0 and Above
ZVM v5.5 and Above
ZVM v6.0 and AbovE
ZVM v6.5 and AbovE
ZVM v7.0 and AbovE
Comments
Dashboard
Yes
Yes*
Yes
Yes
Yes
Events are available from v5.5U4 and above.
VPG List
Yes
Yes
Yes
Yes
Yes
--
VPG Details
Yes*
Yes
Yes
Yes
Yes
Journal size data is available from v5.5 and above.
Monitoring: Alerts
Yes
Yes
Yes
Yes
Yes
--
Monitoring: Tasks
Yes
Yes
Yes
Yes
Yes
--
Monitoring: Events
No
Yes*
Yes
Yes
Yes
Events are available from v5.5U4 and above.
Reports: RPO
Yes
Yes
Yes
Yes
Yes
--
Reports: Journal
Yes*
Yes
Yes
Yes
Yes
Journal size data is available from v5.5 and above.
Reports: Network
No
No
Yes
Yes
Yes
--
Site List & Topology
Yes
Yes
Yes
Yes
Yes
--
End-User (ZORG) Filter
No
Yes*
Yes
Yes
Yes
ZORG filter is available from v5.5u4 and above.
90 Days History for ECE and Cloud
Yes*
Yes*
Yes
Yes
Yes
Journal size data is available from v5.5 and above.
Network reports are available from v6.0.
Licensing Usage
Yes
Yes
Yes
Yes
Yes
--
Storage Analytics Tab
No
No
No
Yes*
Yes
Storage Analytics is available from v6.5u2.
Storage Analytics for VPG Volumes
No
No
No
Yes*
Yes
Storage Analytics is available from v6.5u2.
Planning
No
No
No
No
Yes
Zerto Resource Planner is available from v7.0U1.
Zerto Analytics Secure Architecture
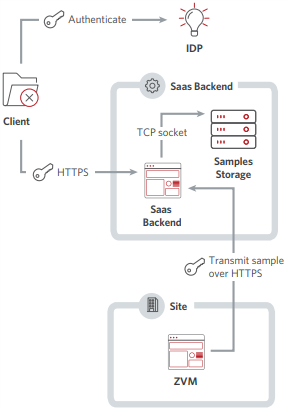
Transmitted Zerto Analytics data is securely stored and can be securely viewed and exported by the user. The data is also used by the analytics engine to provide advanced guidance and analysis. The following section describes the secure architecture that provides the path to transmit, the datastore where the data is housed, and access of that data.
ZVM sends all the data over HTTPS TLS 1.2 only to https://zerto-mobile-data.zerto.com. The data is stored in the Samples Storage in the SaaS backend, located in the public cloud. All communication to and from the cloud are encrypted (HTTPS) using TLS 1.2. Furthermore, the data is isolated in the SaaS backend and accessible only within the backend itself an via VPN from Zerto. End users are authenticated using their myZerto credentials.
Transmission and Storage of Site Status
ZVM transmits current site status over secured HTTPS to the SaaS backend in short (~1 minute) intervals. The SaaS backend collects site status data from all transmitting sites and stores it in the “Samples Storage”. The “Samples Storage” is secured inside an internal protected network and is accessible only within the backend itself and via VPN from Zerto. The samples are kept in the “Samples Storage” of the Zerto Analytics cloud for 30 days to support 30 days of report history.
User Authentication and Authorization
Before sending any request to the backend, a client (browser/mobile/RESTful client) must obtain a security token which securely identifies the user. The security token is achieved by authenticating the user against the Identity Provider (IDP). Each client request contains the security token. For each request, the backend validates the security token and authorizes execution of the request according to the user’s identity which is part of the security token’s payload.
Reporting Historical Data
For each client request, the backend gets the latest data from the relevant samples as stored in the “Samples Storage”. The relevant data is sent to the client.
Zerto Analytics Collected Data
The Zerto Analytics dashboard utilizes several metrics to deliver detailed monitoring and reporting of your multi-site Multi-Cloud environment. The following table was created to address privacy and security issues surrounding data collection.
This table outlines each piece of information that is collected and sent from the ZVM for Zerto Analytics.
Components
Parameter
Description
Alerts
affectedZorgs
List of ZORGs affected by the alert.
affectedZorgIds
List of ZORG IDs affected by the alert.
alertIdentifier
Internal alert identifier.
affectedVpgIds
List of VPG IDs affected by the alert.
alertType
Help identifier associated with the alert.
createdDateinUTC
The time the alerts was created.
description
Alert description.
entityType
The entity for which the alert applies.
severity
Alert severity (Warning or Error).
site
The site which is affected by the alert.
Tasks
taskName
The task type.
taskIdentifier
Unique identifier of the task.
status
The status of the task,
startedDateInUtc
The time the task started.
completedDateInUtc
The time the task was completed.
progress
Progress of the task in percentage of completion.
sitename
Name of the site.
protectedDataInMB
Total data protected in the ZVM site.
siteIdentifier
Internal site identifier.
transmitterCycleInSec
Number of seconds between two (2) data transmissions.
type
Site environment.
initiatedBy
Name of user who initiated task.
information
Task details.
relatedVpgsList
List of VPGs related to the task.
relatedSitesList
List of sites related to the task.
Site
collectionTimeInUtc
Time the ZVM data was collected.
documentVersion
Version of the document.
hashedLicenseKey
ZVM license hashed.
isTransmissionEnabled
Whether transmission of data was enabled by the user.
sitename
Name of the site.
protectedDataInMB
Total data protected in the ZVM site.
siteIdentifier
Internal site identifier.
transmitterCycleInSec
Number of seconds between two (2) data transmissions.
type
Site environment.
utcOffsetInMinutes
Offset of the site time from UTC, in minutes.
version
Zerto Virtual Manager version.
vpgsAlertsCount
Number of active alerts in ZVM.
zorgsCount
Number of ZORGs in the ZVM site.
zvmIp
IP of the ZVM
VPGs
actualJournalHistoryInSeconds
The actual journal history, in seconds.
actualRpoSeconds
Time since the last checkpoint was written to the journal in seconds.
configuredJournalHistoryInMinutes
Configured journal history, in minutes.
configuredRpoSeconds
Configured RPO, in seconds.
earliestRecoveryPointLocalDateInUtc
Time of the earliest checkpoint in the journal.
priority
Priority specified for the VPG.
protectedSite
Protected site details (Site ID, Site Name, Site Type and ZVM version).
recoverySite
Recovery site details (Site ID, Site Name, SiteType and ZVM version).
status
Status of the VPG.
subStatus
Substatus of the VPG.
vpgIdentifier
Identifier of the VPG.
vpgName
Name of the VPG.
zorgName
Name of the Zerto organization set up in the Zerto Cloud Manager, which uses this VPG.
VMS
IOPS
IO per second between all the applications running on the virtual machine in the VPG and the VRA, that sends a copy to the remote site for replication.
journalHardLimit
Maximum journal size in MBs, or in a percentage of the virtual machine volume size.
journalWarningThreshold
Journal size in MBs, or in a percentage of the virtual machine volume size, that generates a warning when the journal is nearing its hard limit.
outgoingBandWidthInMbps
Bandwidth throttling defined for the virtual machines.
provisionedStorageMb
The storage provisioned for the virtual machine in the recovery site.
throughputInMB
MBs of all the applications running on the virtual machine being protected.
usedJournalStorageMb
Storage used by the virtual machine at the recovery site for Journals.
usedStorageMb
Storage used by the virtual machine at the recovery site.
vpgName
The name of the VPG, of which the VM is associated.
vmIdentifier
ID of the VM.
vmName
Name of the VM.
VRAs
vraName
Name of the VRA.
vraVersion
Version of the VRA.
Events
eventIdentifier
The identifier of the event.
eventCategory
Category of the event. (Possible values: VPG, VRA, Site).
eventType
The type of event.
siteIdentifier
The internal site identifier related to the event.
zorgIdentifier
The identifier of the Zerto organization (ZORG), defined in the Zerto Cloud Manager.
zorgName
The name of the Zerto organization (ZORG) set up in the Zerto Cloud Manager.
description
The event description.
occurredOnInUTC
The date the event occurred.
eventCode
The event code.
eventCompletedSuccessfully
Whether the event completed successfully or not.
ZORGs
zorgIdentifier
The identifier of the Zerto organization (ZORG), defined in the Zerto Cloud Manager.
zorgName
The name of the Zerto organization (ZORG) set up in the Zerto Cloud Manager.
Datastores
datastoreIdentifier
The datastore identifier.
datastoreName
The datastore name.
devices
The datastore device.
type
The datastore type.
capacityInBytes
The datastore capacity.
usedInBytes
The datastore usage. (Possible values: journal usage; scratch usage; protected usage; recovery usage; appliance usage; other non-Zerto usage)
Volumes
datastore
The owning datastore.
isThisProvisioned
Provision type.
owningVm
The virtual machine on which the volume is attached.
path
The volume path.
protectedVm
The protected virtual machine to which the volume is related.
size
The volumes used storage.
volumeType
The volume type.
vpg
The VPG to which the volume is related.
Planning
Metrics are collected for all VMs from the source site.
 to open Zerto Analytics in a new browser tab.
 and Help
  widgets in Zerto Analytics to learn more about each of the features available in Zerto Analytics.
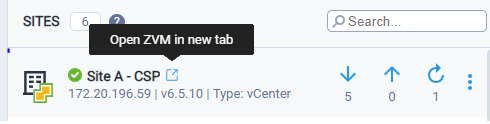
 .
.
 .
.